 BGS Data Catalogue
Organic geochemistry
Type of resources
Topics
Keywords
Contact for the resource
Provided by
Years
Formats
Representation types
Update frequencies
-
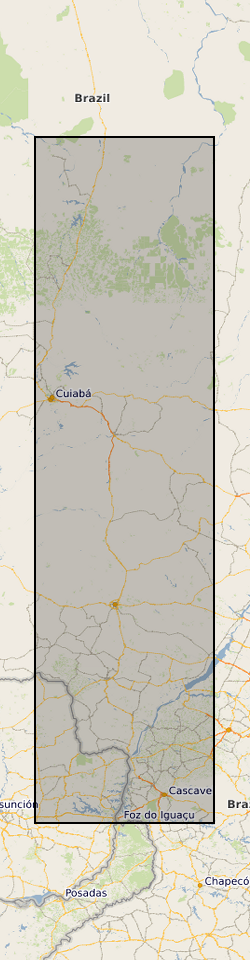
A dataset of DOC and DBC concentrations from 78 sampling locations in South American rivers (surface waters).
-

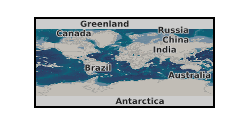
The datasets consist of a spreadsheets containing sporomorph and biomarker data for 145 samples from Eocene sediments recovered by Integrated Ocean Drilling Programme Expedition 318. We studied palynology (pollen and dinocysts) and palaeothermometry based on Glycerol Dialkyal Glycerol Tetraethers (GDGTs) to a sedimentary record from the Wilkes Land margin, East Antarctica, recovered by the Integrated Ocean Drilling Program (IODP Expedition 318 Site U1356). These data sets provide the framework for a terrestrial climate reconstruction for the early Eocene of Antarctica. Further details of the data and their interpretation may be found in Pross et al. (2012), doi:10.1038/nature11300 and Bijl et al. (2013), PNAS, doi/10.1073/pnas.1220872110 The associated NERC grant is NE/I00646X/1 and NE/I00646X/2.
-
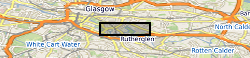
Concentrations of total organic carbon (TOC), total petroleum hydrocarbons, polycyclic aromatic hydrocarbons (PAHs) and polychlorinated biphenyls (PCBs) were determined in 84 near-surface soils (5-20 cm depth) taken from a 255 km2 area of Glasgow in the Clyde Basin, UK, during July 2011. Total petroleum hydrocarbon ranged from 79-2,505 mg kg-1 (mean 388 mg kg-1; median 272 mg kg-1) of which the aromatic fraction was 13-74 % (mean 44 %, median 43 %) and saturates were 28-87 % (mean 56 %, median 57 %). Σ16 PAH varied from 2-653 mg kg-1 (mean 32.4 mg kg-1; median 12.5mg kg-1) and Σ31 PAH range was 2.47-852 mg kg-1 (mean 45.4 mg kg-1; median 19.0 mg kg-1). PCB tri-hepta range was 2.2-1052 mg kg-1 (mean 32.4 mg kg-1; median 12.7 mg kg-1) and the ΣPCB7 was 0.3-344 mg kg-1 (mean 9.8 mg kg-1; median 2.7 mg kg-1). This data is associated with the published research paper https://doi.org/10.1017/S1755691018000324 Kim, A.W., Vane, C.H., Moss-Hayes, V. Berriro, D.B., Fordyce, F., Everrett, P. Nathanail, P.C. 2018. Polycyclic aromatic hydrocarbons (PAH) and polychlorinated biphenyls (PCB) in urban soils of Glasgow, UK. Earth and Environmental Science Transactions of the Royal Society of Edinburgh 108, 2-3, 231-248.
-

The dataset consists of eleven spreadsheet tabs, each tab containing lipid biomarker palaeothermometry (air temperature reconstructions) and bulk organic carbon isotope data from individual lignites that are known to stratigraphically span the Cretaceous-Palaeogene (K-Pg) boundary. Uncalibrated, raw biomarker distributions (glycerol dialkyl glycerol tetraethers; GDGTs) are provided, as well as the calculated calibration outputs. Site coordinates are: West Bijou, Colorado (39°34'14'N, 104°18'09'W), Sussex, Wyoming (43°39'40"N, 106°19'06"W), Pyramid Butte, North Dakota (46°25'03'N, 103°58'33'W), Hell Creek Road, Montana (47°31'35"N, 106°56'23"W), Rock Creek West, Saskatchewan (49°02'20"N, 106°34'00"W), Wood Mountain Creek, Saskatchewan (49°25'20"N, 106°19'50"W), Frenchman Valley, Saskatchewan (49°20’56"N, 108°25’05"W), Knudesn’s Coulee, Alberta (51°54’27"N, 113°02’57"W) Griffith’s Farm, Alberta (51°54’47"N, 112°57’51"W), Coal Valley Cores (GSC CV-42-2, Cores 1 and 2), Alberta (53°05’02"N, 116°47’ 40"W) Police Island, Northwest Territories (64°52'42"N, 125°12'33"W).
-
The UK Geoenergy Observatories (UKGEOS) Glasgow facility, baseline soil geochemistry dataset released from the BGS comprises an excel file with two spreadsheets. The first spreadsheet contains information on the chemical composition of 90 topsoil (0 - 20 cm) samples collected from seven initially proposed borehole sites for the UKGEOS Glasgow facility, and from two control sites, in February-March 2018 (03-18). Ten samples were collected from each site prior to installation of the UKGEOS Glasgow facility, and underwent laboratory analysis. Chemical data for pH and the total concentrations of 54 inorganic and 75 organic substances in the soil samples are presented. In addition, the dataset contains locational and descriptive information about the samples noted during sampling. The analyte name, element chemical symbols, analytical method, units of measurement and limits of quantification are recorded in header rows at the top of the spreadsheet. The dataset includes qualifiers, highlighting any quality control issues reported with the data. The data qualifiers are explained in the second spreadsheet released with the data. Further details about the dataset can be found in the accompanying report http://nora.nerc.ac.uk/id/eprint/527798/.